On April 20, 2010, the Deepwater Horizon oil rig operating in the Gulf of Mexico exploded and sank. Oil and gas moved up the drilling well-bore onto the deck causing a massive fire. The explosion killed 11 platform workers and badly injured 17 others. Following the explosion and sinking of the rig, oil gushed up from the sea floor unabated for 87 days. An estimated 4.9 million barrels of crude oil spilled into the Gulf of Mexico waters inundating the coastlines of Louisiana, Mississippi and Alabama, and damaging coastal ecosystems and fishing industries.
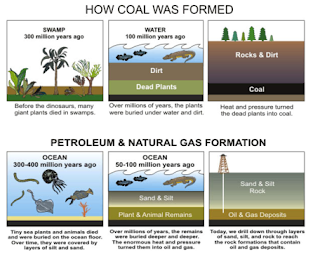
The oil and gas extracted by the DeepWater Horizon rig had been formed and buried in deep sediments millions of years ago. While coal had been used as a fuel resource since 1000 B.C, it wasn't until the arrival of the Industrial Revolution that coal began to replace wood biomass as the primary source of energy. Today, humans are extracting the three primary fossil fuels - coal, oil, and natural gas - to provide energy for a world population that has exceeded 7 billion. Fossil fuels are made of hydrocarbons. In this section of Lab 1, you will investigate how the combustion of fossil fuel hydrocarbons is changing the chemistry of the atmosphere.
Burning hydrocarbons releases energy, and CO2 as a by-product
 Methane, a small hydrocarbon molecule, is found in natural gas. Methane can also occur naturally in environments such as marshes, bogs, and deep ocean.
The Deep Horizon rig was drilling for crude oil (petroleum) deep within bottom sediments in the Gulf of Mexico. Crude oil is a mixture of several different chemicals which can be refined into hydrocarbon products such as such as motor oil, gasoline, jet fuel, diesel fuel, and heating oil. If you drive a car, heat your home, turn on a light, or enjoy a good backyard barbecue, the energy you are using most likely comes from burning fossil fuel hydrocarbons, a process called combustion.
Energy is stored in the chemical bonds that hold the carbon and hydrogen atoms together. When the atoms are rearranged in the combustion reaction, bonds are broken and new bonds formed, releasing energy. The chemical energy stored in these bonds originated from solar energy used by plants to power photosynthesis. During photosynthesis, plants transform solar energy to biochemical energy which becomes stored in the bonds of glucose molecules and other carbon compounds made by plants.
https://serc.carleton.edu/eslabs/carbon/1d.html?epik=dj0yJnU9UGxWSExaS3UxRHJHZklnWVA2VFZPaTMtUWpjT28zdWUmbj1fa09NMW9lWXhpOExCclVvSUxMODd3Jm09MyZ0PUFBQUFBRjJfMkpr
https://www.theguardian.com/environment/ng-interactive/2015/apr/10/how-much-fossil-fuel-are-we-using-right-now?epik=dj0yJnU9MlM5eGt1M2R2TXRpYzRMQnd2TzZFVjJCN09sSEZ2ZGQmbj1LS0hyYUxFSHFic3A1Ukd1eXp1NFRBJm09MyZ0PUFBQUFBRjJfMU5z
Are humans changing the chemistry of the atmosphere?
The video you just watched makes the claim that when humans burn fossil fuels, we release CO2 to the atmosphere causing the atmosphere to become warmer. However, the video provides no data as evidence to support this claim. As a matter of fact, some people on the Internet have claimed that humans have no role in rising CO2and instead blame the rise on natural events such as volcanic outgassing. Providing evidence for a claim is a critical component of science. To that end, you will analyze data from a series of graphs, a NASA animation of CO2 emissions and a video presentation given by geoscientist Dr. Richard Alley. A
Graph 1: Emissions of carbon dioxide to the atmosphere from burning fossil fuels since 1880- the beginning of the Industrial Revolution. Emissions are measured in millions of metric tons of carbon. Figure by Greg Fiske, Woods Hole Research Center
- Click on the links below to view the graphs and watch the video.
- Graph 1: Illustrates the amount of CO2emissions moving into the atmosphere from the combustion of the three most important fossil fuels: oil, gas, and coal from 1880-2004.
- Graph 2 and Graph 3: Go to NASA's Global Climate Change - Vital Signs of the Planet to investigate changes in atmospheric CO2data.
- Graph 4: Go to NASA's Vital Signs for Global Land-Ocean Temperature Index. This data represents temperatures that are above or below a 30 year average of temperature measurements taken from 1950-1980.
- Graph 5: 1000 years of Fossil Fuels allows you to compare trends in three datasets: fossil fuels, CO2 and temperature.
- Video 1: NASA, a year the life of Earth's CO2 . In this video animation, NASA scientists have compressed a year's worth of CO2 data into one year. Can you identify the three areas of the world producing the most CO2?
Stop and Think:
1: Describe how combustion can move carbon atoms from being stored deep in the ground to the atmosphere.2: Identify and explain at least one piece of evidence supporting or refuting the claim that humans are changing the carbon chemistry of the atmosphere.


No comments:
Post a Comment