http://spaceplace.nasa.gov/el-nino/en/
El Niño is a condition that sometimes occurs in the Pacific Ocean, but it is so big that it affects weather all over the world.Weather depends a lot on ocean temperatures. Where the ocean is warm, more clouds form, and more rain falls in that part of the world. In the Pacific Ocean, near the equator, the Sun makes the water especially warm on the surface.
Normally, strong winds along the equator push the warm surface water near South America westward toward Indonesia. When this happens, the cooler water underneath rises up toward the surface of the ocean near South America.

However, in the fall and winter of some years, these winds are much weaker than usual. They actually blow the other way (toward South America instead of Indonesia) in October. So the warm surface water along the equator piles up along the coast of South America and then moves north towards California and south toward Chile.
Many fish that live in the normally cooler waters off the coast of South America move away or die. The fishermen call this condition of warm coastal waters and poor fishing "El Niño" meaning "the Christ Child," because in the occasional years it comes, it comes at Christmas time.


How do you take the ocean's temperature from space?
Where the ocean is warmer, sea level is slightly higher. In 2008, the Jason-2 satellite (also called the Ocean Surface Topography Mission) was launched into orbit around Earth. It continued the measurements being made by Jason-1, launched in 2001. Both satellites have a sensitive altimeter onboard. An altimeter measures height from itself down to the Earth's surface (land or water).
Jason-1
uses radar to measure the small hills and valleys of the ocean's
surface. This information helps scientists understand ocean circulation
and predict climate events such as El Niño. Jason-1 was launched in 2001
and is still working!
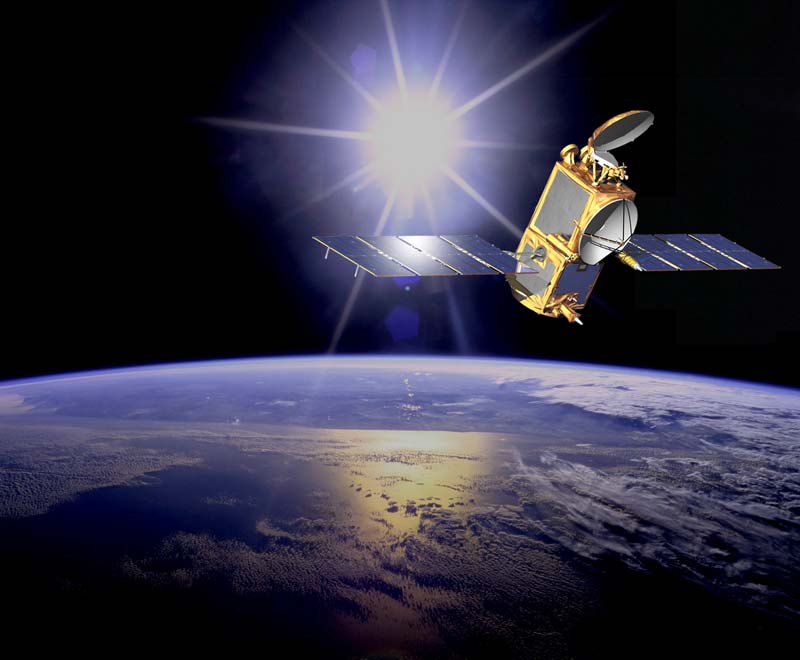
Jason-2,
also called the Ocean Surface Topography Mission, continues the work
begun by Jason-1. Jason-2 was launched in 2008 and is still orbiting and
collecting data.


No comments:
Post a Comment